TL;DR
IFRS 9 impairment spreadsheet risk grows as loan volumes, data sources, and regulatory scrutiny increase. This article explains why spreadsheets fail under IFRS 9 pressure, from manual data integration and formula drift to missing audit trails and scaling limits. You learn how IFRS 9 impairment calculation really works across PD, LGD, and staging, and why automating credit loss models delivers consistent, auditable results. If you rely on spreadsheets today, this guide helps you understand the risks and decide when automation becomes essential.
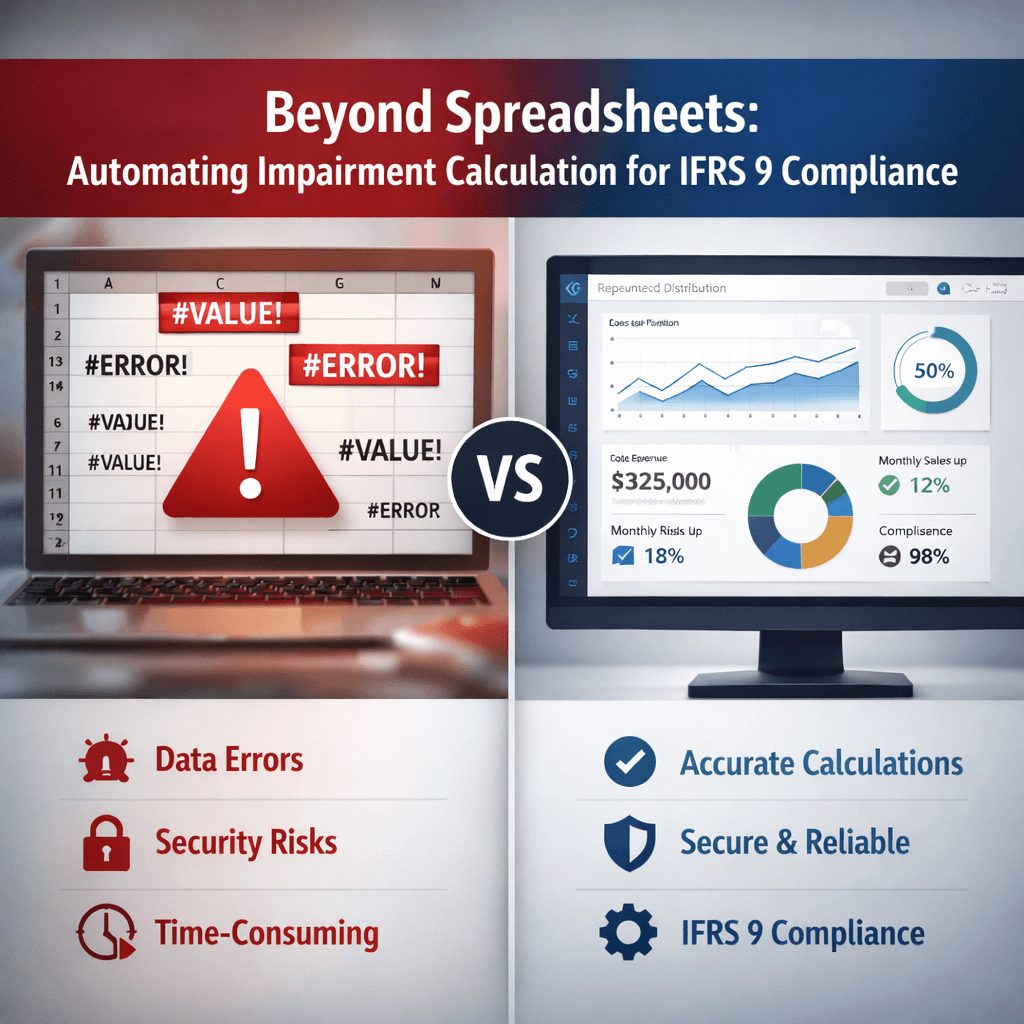
Spreadsheets have powered accounting and finance for decades. They’re familiar, flexible, and readily available on every computer. But when you’re managing IFRS 9 impairment calculations for a growing loan portfolio, familiarity can become a liability. The numbers grow larger.
The deadlines compress. The regulatory scrutiny intensifies. And suddenly, that spreadsheet isn’t just handling data anymore, it’s becoming a control risk.
In 2025, many financial institutions still rely on spreadsheets for expected credit loss computation, which isn’t optimal given the data volume needed for both calculation of different components and final ECL estimates at each reporting date, according to a research from KPMG.
The challenge isn’t theoretical. It’s real, measurable, and growing every quarter.
What’s interesting is that IFRS 9 impairment spreadsheet risk emerges not from a single flaw, but from the compounding effect of manual workflows, isolated data sources, and the absence of automated audit trails. This article breaks down why spreadsheets fail under IFRS 9 pressure and what actually works instead.
What Is IFRS 9 Impairment and Why Spreadsheets Fail
IFRS 9 requires you to recognize expected credit losses before a customer defaults. You’re not waiting for proof of a loss. You’re estimating it upfront based on forward-looking information, historical trends, and economic scenarios.
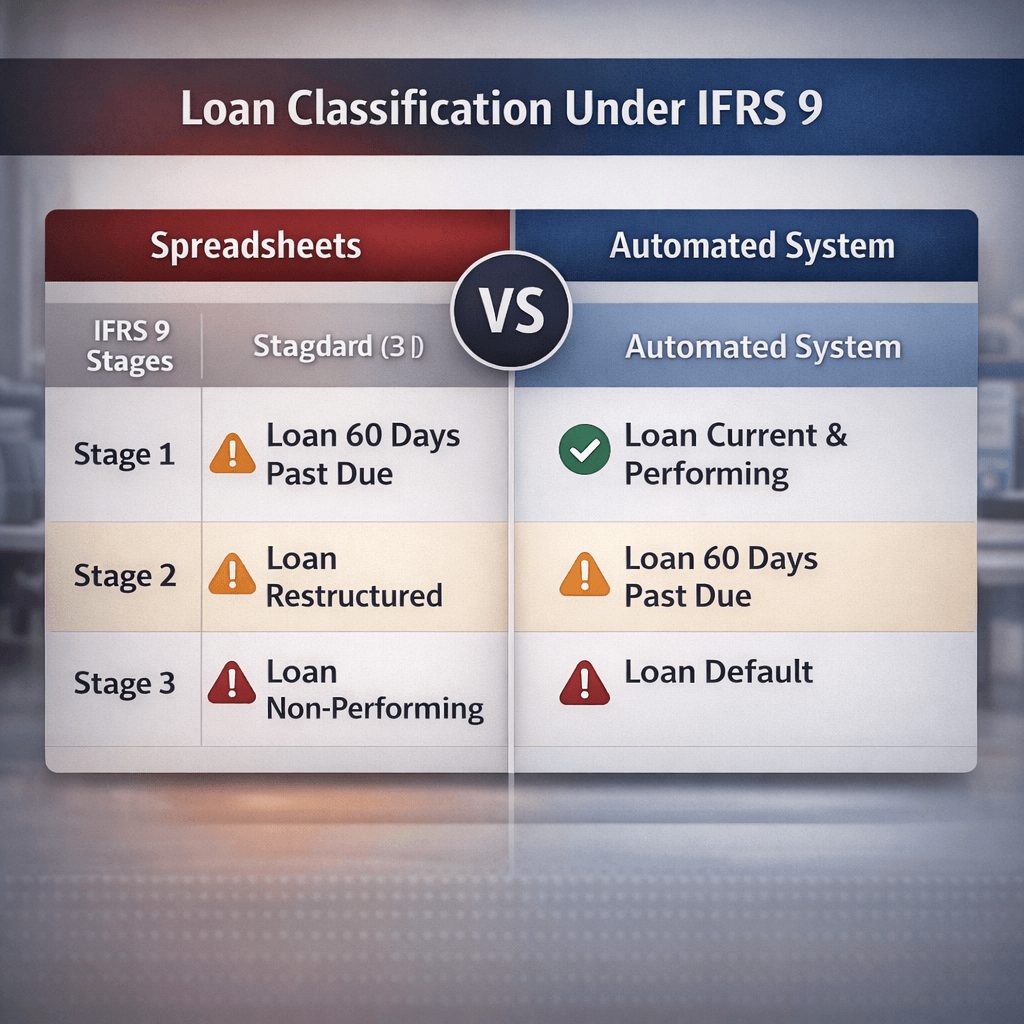
This shift from incurred loss models to expected credit loss models fundamentally changed how banks account for credit risk. Stage 1 assets require a 12-month ECL estimate.
Stage 2 assets require a lifetime ECL once credit deterioration is detected. Stage 3 assets are defaulted and require specific impairment calculations. Learn more about IFRS 9 compliance process architecture.
Here’s where spreadsheets start breaking down.
Spreadsheets live in isolation. Your loan data sits in one system. Your economic scenario data lives in another. Your PD and LGD models might exist across three separate tabs managed by different people. When you need to integrate these elements for a month-end ECL calculation, you’re manually pulling data, copying formulas, and manually reconciling results. Each manual step is a chance for error.
What really matters is control. IFRS 9 impairment calculations require documented methodology, replicable assumptions, and audit-ready trails. Spreadsheets can’t provide this consistently.
Post model adjustments can be applied externally, often using a spreadsheet separate from the main model in the IFRS 9 ECL context, which fragments your calculation logic and creates reconciliation headaches, according to Deloitte.
The spreadsheet becomes a black box. You can see the final numbers, but proving the calculation path becomes difficult for auditors and internal reviewers.
IFRS 9 Impairment Spreadsheet Risk: Key Control Gaps
Spreadsheet-based IFRS 9 impairment calculation introduces five specific control failures.
Data Integration Complexity
Your loan portfolio lives in core banking system. Credit scores update in risk systems. Macroeconomic forecasts come from external vendors. Collateral valuations exist in separate databases. A spreadsheet model can’t pull real-time data from all these sources simultaneously. You’re either importing outdated snapshots or entering data manually, introducing both delays and human error.
Formula Drift
A formula in column C calculates PD. Six months later, someone tweaks it to account for a new credit strategy. They don’t update the version control or documentation. Next quarter, someone else references the old formula. Your calculations diverge mid-year, and no one realizes it until audit season when the numbers don’t reconcile.
Lack of Scalability
A spreadsheet handles 5,000 loan accounts reasonably well. Add 50,000 accounts, and calculation time stretches from minutes to hours. You’re now waiting overnight for ECL models to recalculate, which makes intra-month adjustments impractical and delays reporting.
Audit Trail Absence
When an auditor asks who changed the PD assumption and when, a spreadsheet can’t answer definitively. You have version history through file management, but no timestamp, no user attribution, and no documented reason for the change.
Manual Reconciliation Burden
You calculate ECL in spreadsheets. You validate against your core system. They don’t match. Now you’ve got two days to figure out why. Was it a formula error? A data lag? A missing loan cohort? The diagnostic work is manual and time-consuming.
How Automation Improves IFRS 9 and IAS 19 Valuation Accuracy
Dedicated IFRS 9 automation platforms solve each of these problems directly.
First, they integrate data at the source. Instead of importing exports, the system connects to your core platform, your risk systems, and your economic data vendors simultaneously.
When interest rates change, your scenario assumptions update automatically. When a loan is booked, it flows directly into your ECL model without manual intervention.
Second, they enforce calculation consistency. The system locks methodology into configuration. Everyone calculates PD, LGD, and probability of default using the same formula. There’s no drift, no parallel calculations, no formula variations.
Third, they handle scale. A modern cloud-based system calculates ECL for 500,000 accounts in the time a spreadsheet takes to handle 50,000. You can run sensitivity analysis on the fly. You can test policy changes before implementation.
Fourth, they create audit-ready documentation automatically. Every calculation is timestamped. Every assumption is logged. Every model override is flagged with user ID, timestamp, and business reason. When auditors review your ECL impairment methodology, you hand them a complete, auditable trail.
Fifth, they reduce reconciliation friction. Your core system and your ECL system talk to each other. Discrepancies surface immediately and are traced to their root cause—data lag, formula difference, or methodology variance.
Beyond automation, consistency matters for regulatory capital. When IFRS 9 adoption occurred, banks in Jordan increased their capital-to-assets ratio by 0.3%, reduced equity ratios by 1.14%, and cut loan-to-assets ratios by 2.91%, reflecting the impact of uniform application across their portfolios, as shown in research published by Business Perspectives.
IFRS 9 Impairment Models Explained (ECL, PD, LGD, EIR)
Understanding the components of IFRS 9 ECL calculations helps you appreciate why automation matters.
What Is Expected Credit Loss (ECL)?
Expected credit loss is your forward-looking estimate of losses you’ll incur on a loan portfolio. It’s calculated as probability of default multiplied by loss given default multiplied by exposure at default.
The formula is straightforward: ECL = PD × LGD × EAD. But executing it reliably across thousands of loans and multiple scenarios is complex.
What Does EIR Mean in IFRS 9?
The effective interest rate is the rate built into your loan contract. It drives how you accrete interest income and how you recognize ECL charges. When you calculate ECL, you use EIR to determine the timing of future cash flows you’re estimating.
How PD and LGD Drive Impairment Results
Probability of default measures the chance a borrower won’t pay within 12 months (Stage 1) or over the loan’s lifetime (Stages 2 and 3). Loss given default measures what percentage of outstanding principal you’ll lose after the borrower defaults and you’ve exhausted collateral recovery.
These two components drive 80% of ECL variance. Small changes in PD or LGD produce outsized changes in impairment. That’s why consistent, documented, auditable calculation of PD and LGD is critical.
A spreadsheet makes it hard to track how you’re calculating these. An automated system shows you exactly which borrowers moved to which stage, which PD formula applied, and what LGD scenario was used.
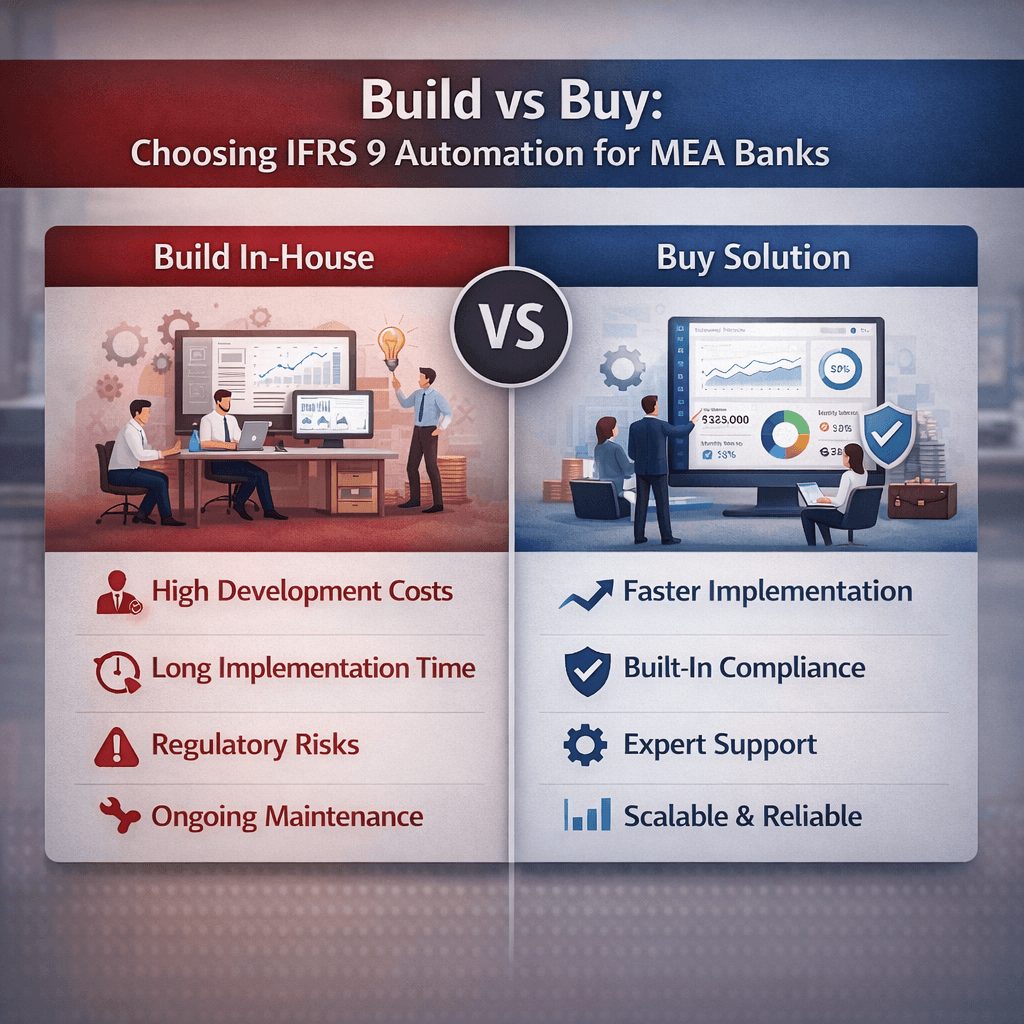
Build vs Buy: Choosing IFRS 9 Automation for MEA Banks
You’re considering moving beyond spreadsheets. Your next question is usually: build a custom system or buy a vendor solution?
Building in-house gives you customization but takes 6-18 months, demands significant IT resources, and requires ongoing maintenance as regulations change. You’re paying salaries, licensing development tools, and running infrastructure.
Buying a vendor platform deploys in 3-6 months, includes automation for modeling and reporting, and spreads costs across your institution and the vendor’s client base. You trade customization for speed and lower upfront investment.
Many banks use a hybrid approach. You buy the core IFRS 9 automation platform but configure it to match your specific methodologies. This gets you 80% of the automation benefits without the full development timeline. For detailed guidance on this trade-off, see build vs buy IFRS 9 software TCO analysis for banks.
The real cost driver isn’t licensing. It’s the work to clean your data, document your current methodology, and align stakeholders around a new process. Whether you build or buy, that effort is identical and essential.
Hybrid IFRS 9 Platforms: When Spreadsheets Meet Systems
Some institutions try a compromise: keep some logic in spreadsheets and add a system for others.
This usually creates more problems than it solves. Your system calculates some impairment. Your spreadsheet calculates different impairment. Now you’re reconciling two separate calculations, maintaining documentation in two places, and managing two audit trails.
What’s interesting is that hybrid approaches often cost more than full automation because you’re maintaining both the old process and the new system simultaneously. Full migration to an automated platform is usually faster and cheaper long-term.
Regulatory Expectations in KSA, UAE & Pakistan
Regulators across the Middle East and South Asia are tightening expectations around IFRS 9 impairment control and documentation.
The Saudi Central Bank (SAMA), the UAE Central Bank, and the State Bank of Pakistan all expect institutions to demonstrate consistent application of IFRS 9 methodology. They want to see auditable trails, consistent treatment of similar exposures, and documented governance around model changes.
A spreadsheet-based process makes this difficult to demonstrate. A system-based process makes it straightforward. Regulators now view automation not as optional but as evidence of serious control.
Stage 2 loan exposures are growing. EU/EEA banks reported Stage 2 loans surging to EUR 1.56 trillion as of December 2024, with the proportion of Stage 2 loans to total loans reaching 9.7%, according to EBA data.
Higher Stage 2 volumes mean more frequent stage transfers and more complex ECL modeling. Your systems need to keep pace.
Common Errors in Spreadsheet-Based Impairment
Before you commit to automation, understand what can go wrong with spreadsheets.
Stage allocation logic breaks down when you’ve got thousands of loans updating simultaneously. A borrower moves from Stage 1 to Stage 2, but the spreadsheet calculation logic doesn’t catch it because the trigger condition is buried three sheets deep in the logic.
The borrower stays in Stage 1 and gets 12-month ECL instead of lifetime ECL, understating impairment.
Model parameter lags cause similar issues. You update your PD model in October, but the spreadsheet that pulls PD data still references the September version. For 30 days, you’re calculating ECL with stale assumptions.
Collateral valuation errors compound quickly. If you’ve got 200 loans with manual collateral valuations in a spreadsheet, even a 2% error rate means four loans are grossly misstated in your LGD calculations.
How Automated Workflows Reduce Credit Risk
Automation doesn’t just improve accuracy. It reduces the actual credit risk you’re measuring.
When impairment calculation is delayed or inaccurate, you’re either overstating or understating provisions. Understating provisions artificially inflates your capital ratios and profitability.
Regulators notice. Auditors flag it. Overstating provisions ties up capital inefficiently and masks credit quality improvements.
Automated systems calculate impairment consistently and on schedule. This means provisions are timely and accurate, which means capital ratios reflect actual risk, which means you can compete fairly and report credibly.
Average provisions for performing IFRS 9 loans are higher than comparable loans under prior national GAAP standards, reflecting the forward-looking nature of ECL, according to ECB data.
This shift favors institutions with robust automation because they can distribute provisions accurately across their portfolio without the operational burden that drives smaller competitors toward flat or inflated provisioning.
Steps to Implement IFRS 9 Automation
Migration from spreadsheets to automation doesn’t happen overnight, but it doesn’t need to take years.
Step One: Audit Your Current State
Document how you’re currently calculating IFRS 9 impairment. Map data sources. Identify hand-offs. List manual adjustments. Find where your spreadsheet logic lives and who maintains it.
Step Two: Define Your Target Methodology
Work with finance, risk, and audit to document exactly how impairment should be calculated. This isn’t about changing your methodology. It’s about making it explicit and consistent.
Step Three: Assess Technical Requirements
Determine whether you need to build or buy. Evaluate vendors against your data architecture and governance needs. See enterprise IFRS 9 ECL software selection guidance.
Step Four: Clean and Standardize Data
Your new system is only as good as the data feeding it. Spend time removing duplicates, standardizing loan terms, and reconciling core system records.
Step Five: Configure and Test
Build your ECL logic in the new system. Run parallel calculations against your current spreadsheet approach. Debug discrepancies. Build confidence in the output.
Step Six: Run Parallel for One Full Cycle
Calculate IFRS 9 impairment in both your old spreadsheet and new system for one full reporting period. Validate that results match. Investigate any divergences.
Step Seven: Cutover and Monitor
Switch to the new system as your primary calculation engine. Keep historical spreadsheet logic available for reference but freeze it for ongoing use.
Data, Audit Trails, and Model Validation
The real value of automation sits in three areas.
Data Governance
A system enforces data quality rules automatically. Loan records with missing obligor IDs are flagged. Collateral valuations older than 12 months trigger exceptions. Data completeness improves simply because the system demands it.
Audit Trails
Every calculation is logged with timestamp, user ID, and system source. When an auditor asks when your PD model changed, you pull up the audit trail and show exactly who changed it, when, and why. This level of transparency eliminates weeks of forensic work.
Model Validation
Your ECL model produces output. How do you know it’s correct? An automated platform lets you run backtests. Compare your predicted losses against actual losses. Identify model breaks. Adjust parameters based on evidence.
Spreadsheets allow this in theory but rarely in practice. The manual effort is too high.
Ongoing Costs of IFRS 9 Systems
Automation isn’t free, but the costs are predictable and lower than maintaining sprawling spreadsheet operations.
If you buy a platform, you pay license fees (usually per-user or per-calculation basis), implementation support, and annual maintenance. If you build in-house, you pay developer salaries, infrastructure hosting, and operational support.
Hidden costs exist in either scenario: training staff on new workflows, updating procedures manuals, and reconciling output to prior periods.
The best measure is total cost of ownership across three years. Most banks discover that automation becomes cost-neutral within 18-24 months when you account for reduced audit hours, faster month-end close, and improved capital efficiency.
Checklist for Migrating from Spreadsheets to Automation
Before you commit to IFRS 9 automation, work through this checklist.
Have you documented your current ECL methodology in writing? Do you know which loans are in each stage and why? Can you trace your collateral valuation data to a single authoritative source? Do you understand your PD and LGD calculation methodologies completely? Have you identified all manual adjustments currently made to ECL output? Can your IT team connect your core system to external data sources? Do you have governance around model changes and documentation? Can your audit and compliance teams audit your current process end-to-end?
If you answered no to more than two of these, you’re a strong candidate for IFRS 9 automation.
Key Data Inputs for Accurate IAS 19 Valuation
While this article focuses on IFRS 9 impairment, IAS 19 employee benefit calculations run parallel. Both require forward-looking estimates and consistent documentation.
For IAS 19, you need employee census data, salary projections, discount rates, and actuarial assumptions. Just as with IFRS 9, manual spreadsheet management of these inputs creates audit risk and calculation inconsistency.
Many institutions standardize around shared data platforms that feed both IFRS 9 and IAS 19 calculations, reducing manual rework and ensuring consistency across financial reporting.
Spreadsheets got you through the early years of IFRS 9 adoption. But as your portfolio grows and regulation tightens, the operational burden and control risk become untenable. Automation doesn’t mean complexity. It means consistency, speed, and auditability.
The transition from spreadsheets to dedicated IFRS 9 impairment systems is no longer optional for institutions taking risk seriously. Start by auditing your current process, documenting your methodology, and assessing whether your spreadsheet approach still matches your actual business needs. Most institutions discover quickly that it doesn’t.
Ready to evaluate IFRS 9 automation for your institution? Visit Prima Consulting to discuss your specific impairment challenges and explore how systematic automation can reduce manual effort while improving control and accuracy.
FAQ
What’s the fastest way to move from spreadsheets to IFRS 9 automation?
Buying a vendor platform typically deploys in 3-6 months. Building in-house takes 6-18 months. Most banks see ROI within 18-24 months regardless of the path chosen.
Can I keep my current IFRS 9 methodology if I automate?
Yes. Automation systems are configured to match your existing methodology. You’re not changing how you calculate ECL. You’re moving that same logic into a system that enforces consistency.
What happens to my spreadsheets after I implement automation?
Keep them archived for reference, but freeze them for ongoing use. They become historical records, not active calculation tools.
Do I need to change my PD and LGD models when I automate?
Not necessarily. You can migrate your existing models into the new system. That said, many banks review and improve their PD and LGD models during automation projects because they’re documenting methodology in detail for the first time.
How do I justify the cost of IFRS 9 automation to management?
Frame it as control risk reduction and operational efficiency. Calculate the cost of audit hours spent on spreadsheet reconciliation, the risk of month-end delays, and the capital cost of misaligned provisions. Automation typically pays for itself within two years.