
TL;DR
IAS 19 valuation errors don’t start with bad math. They start with demographic assumptions that no longer reflect your workforce. This article breaks down the most common projection mistakes, from outdated mortality tables to inconsistent payroll data, and shows how each one distorts your defined benefit obligation. You’ll learn what auditors look for, how salary growth risks and discount rate volatility compound these errors, and what a sound assumption review process looks like. Read on to find out where your valuation may be exposed and what to do about it.
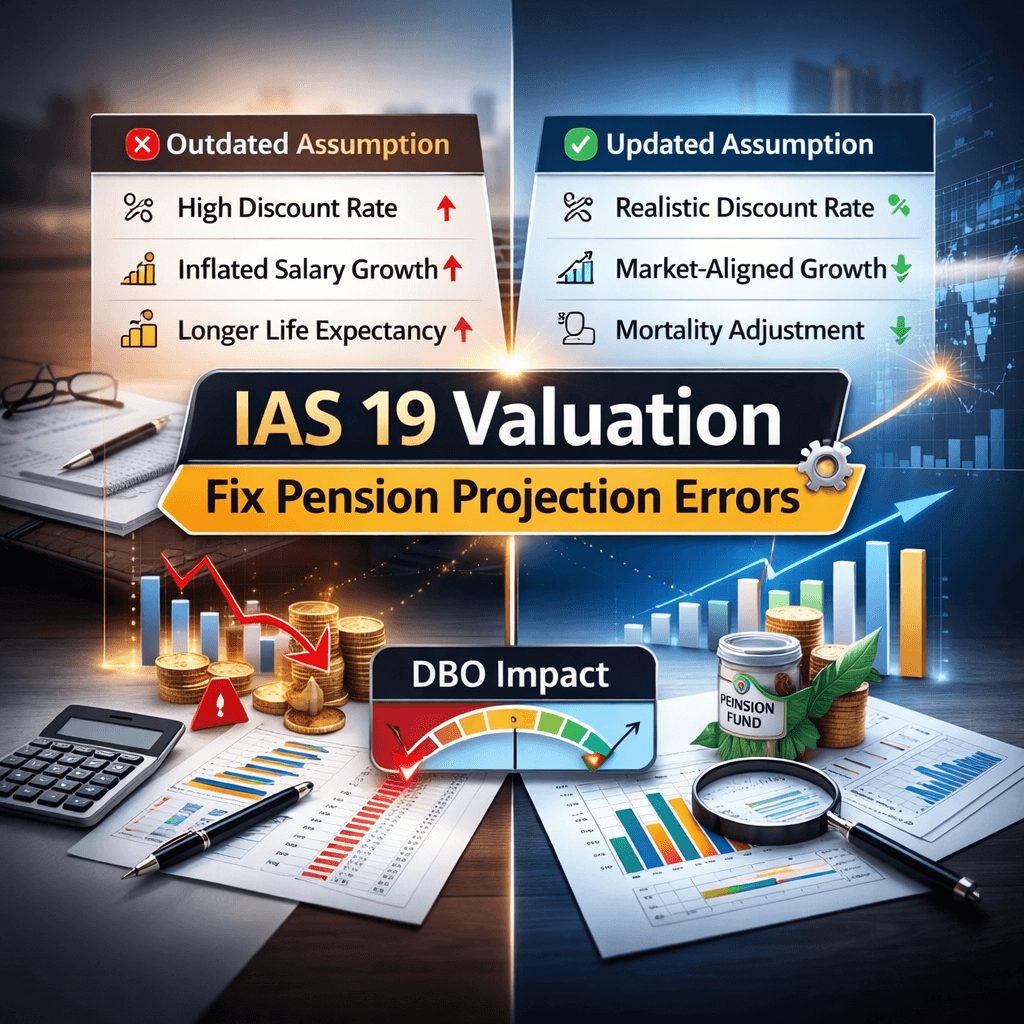
IAS 19 Valuation: Fix Pension Projection Errors
Your pension numbers can look right on paper and still be wrong. That’s the quiet risk sitting inside most IAS 19 valuation processes today. When demographic assumptions don’t match reality, the defined benefit obligation (DBO) shifts, and so do your financial statements.
Demographic projection errors are one of the most common causes of IAS 19 restatements worldwide. They don’t always come from careless work. They come from outdated data, manual processes, and assumption frameworks that haven’t kept pace with changing workforce trends. Understanding where these errors start is the first step to stopping them.
What is IAS 19 valuation in pensions?
IAS 19 valuation is the process of measuring a company’s obligations under defined benefit pension and end-of-service benefit plans. It determines how much the employer owes to current and future retirees, discounted to today’s values.
The standard requires companies to apply actuarial methods and reflect realistic assumptions about future events. These include when employees will retire, how long they’ll live after leaving, and how salaries will grow before their final payout.
IAS 19 valuation assumptions explained
IAS 19 valuation relies on two categories of assumptions: financial and demographic. Both feed directly into the DBO calculation, and errors in either category distort the liability.
Financial vs demographic assumptions
Financial assumptions include the discount rate, expected salary increases, and inflation. Demographic assumptions cover mortality rates, employee turnover, and expected retirement ages. To put it simply, financial assumptions reflect market conditions. Demographic assumptions reflect how your workforce behaves and how long it lives.
Why assumption alignment matters
Both categories have to work together. You can get the discount rate right and still misstate your DBO by 10 percent or more if your mortality table is five years out of date. That’s why IAS 19 requires that all assumptions reflect the best estimate of future experience, not just historical patterns.
Key demographic assumptions driving errors
Mortality and longevity trends
Mortality rates tell the actuary how long retired employees are expected to receive benefits. When life expectancy rises faster than expected, pension obligations grow. In Saudi Arabia, life expectancy increased from 52 years in 1969 to 78 in 2022, which prompted a 2024 pension reform raising the statutory retirement age from 58 to 65 to reflect revised longevity projections [1].
Across the GCC, the population over 60 is projected to increase from 4% in 2015 to 21% in 2050 [2]. Plans that haven’t updated their mortality tables to reflect this shift are likely understating their DBO significantly.
Retirement age assumptions
Retirement age directly affects how much benefit gets paid and for how long. When actuaries use a statutory retirement age that doesn’t reflect actual workforce patterns, service cost calculations go wrong. In aging populations, employees often retire later than the statutory age, which can reduce the liability. But if your assumption still reflects an older, lower retirement age, you’re overstating costs.
Employee turnover and attrition
Turnover assumptions estimate how many employees will leave before reaching retirement, forfeiting their accrued benefits. Overstating turnover reduces the DBO; understating it overstates the obligation. In fast-growing industries or post-pandemic workforce markets, historical turnover data can be misleading. From there, poor turnover assumptions create cascading errors in service cost projections.
Salary growth and workforce changes
Salary assumptions affect how large the final benefit will be. If salary increases are underestimated, the projected benefit at retirement is too low, and the DBO is understated. At the same time, structural shifts like organizational restructuring or sector-specific wage growth patterns can make standard salary scales unreliable.
Top causes of demographic projection errors
Outdated mortality tables
Most IAS 19 errors tied to mortality come down to one thing: using the wrong table. Post-COVID longevity patterns have shifted in many markets. The GCC’s median age is projected to rise from 32 in 2022 to 51 by 2100 [3], meaning current tables may already be outdated. IAS 19 para 82 specifically requires that mortality assumptions account for expected improvements over the benefit period, not just current rates.
Inconsistent workforce data
Demographic assumptions are only as reliable as the data behind them. If payroll records misclassify active employees as deferred, or if headcount data isn’t reconciled with HR systems, the entire assumption set is built on a flawed foundation. Manual data entry is where most of these gaps start.
You can see how manual IAS 19 valuation risks manual IAS 19 valuation risks turn small data inconsistencies into material reporting errors.
Poor alignment with local demographics
Using generic industry-wide tables in markets with distinct demographic characteristics is a common mistake. The elderly over 50 in the GCC are projected to reach 18.5% of the population by 2025, up from 14.2% in 2020 [4]. Plans applying assumptions designed for Western European populations to GCC workforces will get the liability wrong.
Ignoring future experience trends
Assumptions must reflect future expectations, not just past averages. Actuaries who rely entirely on historical experience without adjusting for observable trends in mortality, workforce mobility, or economic conditions are setting up the valuation for a mismatch. That mismatch shows up as actuarial losses in future periods.
How do demographic errors impact liabilities?
Effect on defined benefit obligations
The DBO is the present value of all future benefit payments expected to be made. Any demographic assumption that increases the projected benefit payment, or extends the payment period, increases the DBO. A 1-year extension in assumed life expectancy can raise a pension liability by 3 to 5 percent depending on plan design and discount rates.
Impact on service cost and interest cost
Service cost reflects the benefit earned in the current period. It’s calculated using the same demographic assumptions as the DBO. If turnover is overstated, service cost is understated. If retirement age is wrong, the attribution of benefits across years of service shifts and distorts profit or loss.
Volatility in actuarial gains and losses
When actual experience differs from assumptions, the difference is recognized as an actuarial gain or loss under IAS 19. Plans with poorly calibrated demographic assumptions will consistently generate large actuarial swings, making equity more volatile and drawing auditor attention.
Common IAS 19 valuation mistakes to avoid
For more on the technical side of actuarial assumption errors, see the ias 19 actuarial valuation reference published on IFRSTech.
Mixing financial and demographic assumptions
Salary assumptions sit at the intersection of both categories. Using a nominal salary growth figure when the discount rate is real, or vice versa, creates a systematic mismatch. The two must use a consistent inflation basis to produce a valid liability.
Failure to update assumptions annually
IAS 19 requires that assumptions be reviewed at each reporting date and updated to reflect current conditions. Organizations that carry forward last year’s assumptions without a formal review process are non-compliant, regardless of whether the numbers changed significantly. Annual reviews aren’t optional; they’re required.
Weak documentation and audit trails
Assumptions must be documented with enough detail to allow independent verification. An actuary who can’t show the basis for a turnover table, or can’t explain why a specific mortality scale was selected, will face pushback in any audit. Documentation is the difference between a defensible valuation and a qualified opinion.
Auditor focus areas in IAS 19 valuation
Assumption reasonableness checks
Auditors will test whether each assumption is within a reasonable range given market data, industry norms, and entity-specific experience. If a turnover rate is far below industry averages with no supporting explanation, it will be flagged.
Data accuracy and completeness
Auditors check that demographic data, such as headcount, service history, and salary records, matches payroll and HR source systems. Payroll inconsistencies that trigger full revalidation of turnover and salary scales are among the most common red flags.
Consistency with market benchmarks
Discount rates must be based on high-quality corporate bond yields per IAS 19 para 84. Auditors compare selected rates against observable market benchmarks for consistency. Demographic assumptions are also compared against published national statistics or industry studies where available.
Regional risks in pension assumptions (Middle East and Asia)
Data limitations in emerging markets
In many GCC and Asian markets, published mortality tables and longevity studies are limited. Actuaries in these markets often apply adjusted tables from more data-rich environments, which introduces assumption risk. Old-age dependency ratios in the Gulf are projected to quadruple from less than 5% in 2015 to more than 20% by 2050 [5]. Plans that haven’t factored this into demographic assumptions are materially exposed.
Regulatory and market differences
Retirement ages, benefit formulas, and end-of-service gratuity structures differ significantly across GCC countries. What applies in the UAE may not apply in Qatar or Kuwait. Assumptions need to reflect each entity’s specific legal and market context, not a regional average.
Country-specific demographic variations
Workforce composition in GCC countries includes large proportions of expatriate workers with different tenure patterns and salary structures than national employees. Treating both groups under a single assumption set produces inaccurate results. Segmenting the workforce by demographic profile gives the actuary a cleaner basis for assumption-setting.
Best practices to improve IAS 19 valuation accuracy
Use of credible demographic data
Start with national statistics, population registries, or industry workforce studies where they exist. For markets with limited data, work with your actuary to document the basis for any adjustments applied to standard tables. Credibility depends on transparency.
Regular assumption reviews
Set a formal calendar for assumption reviews tied to the reporting cycle. Don’t wait for experience studies to trigger a review. Reviewing assumptions annually reduces the risk of cumulative mismatches building up into a material restatement.
Sensitivity analysis and stress testing
Run sensitivity tests for each key demographic assumption. A 10% change in turnover, a one-year shift in retirement age, or a one-year change in life expectancy each produce a measurable DBO impact. Quantifying that impact helps management understand the range of liability outcomes and communicate it clearly in financial statement disclosures.
Strong data governance processes
Data quality is the foundation of accurate actuarial projections. Build a process that reconciles payroll and HR records before each valuation cycle. Employee misclassification, duplicate records, and missing service histories are all fixable, but only if you have a process to catch them.
How to validate and update demographic assumptions
Experience studies and trend analysis
An experience study compares actual outcomes, such as how many employees resigned or retired in a year, against what the assumptions predicted. Where there’s a gap, the actuary revises the assumption forward. IAS 19 doesn’t specify frequency, but annual experience studies are standard practice for larger plans.
Benchmarking with industry data
Compare your assumptions against published benchmarks from actuarial societies, government statisticians, or peer group studies. If your turnover rate is significantly different from the industry average, you need a documented reason. Without it, you’re exposed in an audit.
Collaboration with actuarial experts
Demographic projections are technical. CFOs and finance teams need to work closely with qualified actuaries to review assumption sets, not just accept the output. That collaboration should be documented, especially when departing from standard tables or making significant assumption changes.
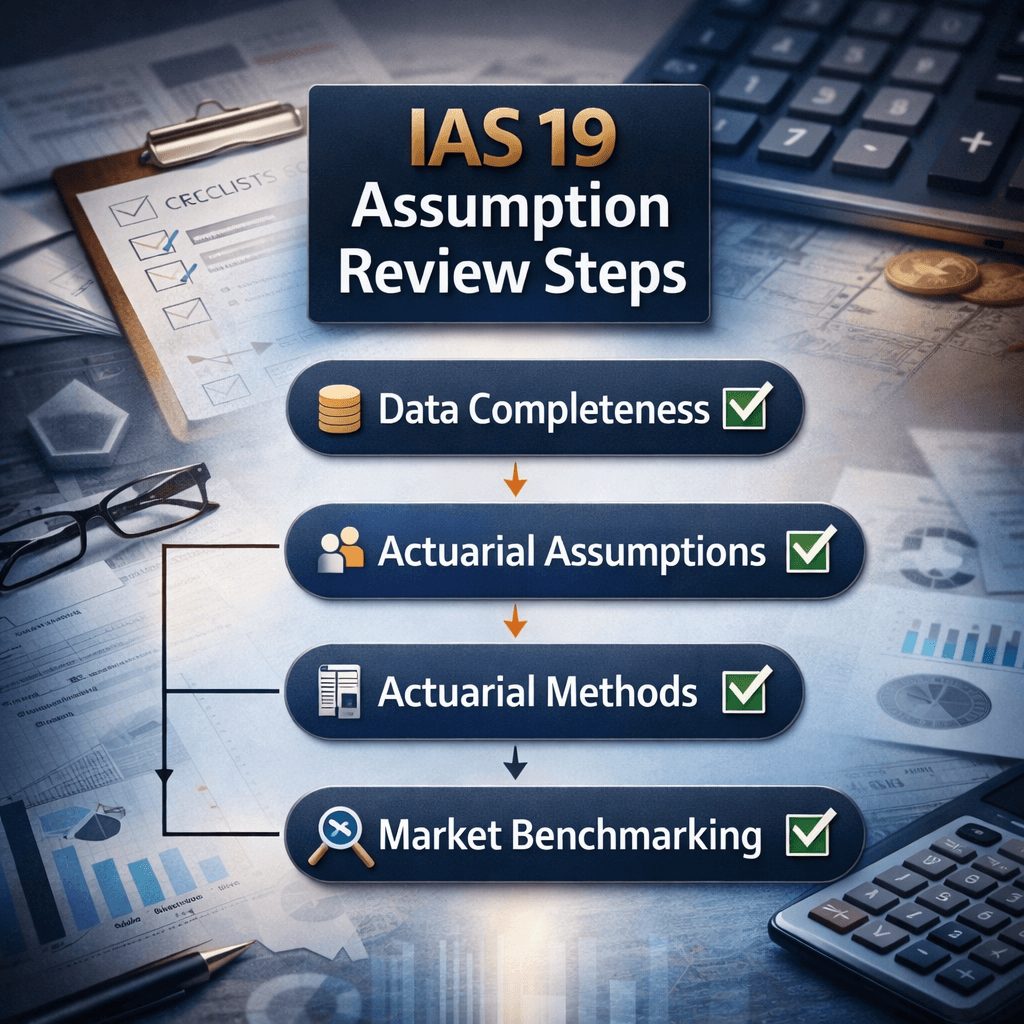
IAS 19 valuation checklist for error-free reporting

Use this checklist to review your IAS 19 valuation before sign-off.
Data preparation
- Reconcile headcount with payroll records
- Confirm employee classification (active, deferred, retired)
- Verify salary and service history accuracy
Demographic assumption review
- Confirm mortality table is current and includes improvement factors
- Verify turnover rates are based on recent experience data
- Check retirement age reflects actual workforce patterns
- Segment assumptions by workforce group where needed
Financial assumption review
- Confirm discount rate is based on high-quality corporate bonds per IAS 19 para 84
- Verify salary growth uses consistent inflation basis with discount rate
Documentation and audit readiness
- Document the basis for each assumption with supporting evidence
- Retain prior-year assumptions for comparison
- Prepare sensitivity analysis for key variables
Annual review compliance
- Confirm all assumptions have been reviewed at this reporting date
- Record any changes made and the rationale for each
Frequently Asked Questions
What are demographic assumptions in IAS 19 valuation?
Demographic assumptions are estimates about the future behavior and characteristics of the employee population. They include mortality rates, employee turnover, expected retirement ages, and workforce composition. These assumptions directly affect how large the defined benefit obligation will be and when benefit payments are expected to occur.
Why do demographic projection errors cause restatements?
When a demographic assumption proves significantly wrong, the difference between expected and actual outcomes creates an actuarial gain or loss. If errors are large enough to be material, companies may need to restate prior period financials. Restatements are costly and attract regulatory scrutiny.
How often should IAS 19 demographic assumptions be updated?
IAS 19 requires assumptions to be reviewed at each reporting date. Most organizations with defined benefit plans do a formal assumption review annually, aligned with the valuation cycle. Material changes in workforce patterns or longevity data may require an interim update.
What triggers an auditor to question demographic assumptions?
Auditors flag assumptions that fall outside reasonable industry ranges, lack documented support, or haven’t been updated in multiple years. Payroll data that doesn’t match the actuarial data set is another trigger. Inconsistencies between demographic assumptions and observable workforce data are among the most common audit findings.
What are spreadsheet demographic audit failures in pension valuations?
Spreadsheet demographic audit failures refer to errors that arise when pension valuations are built and maintained in manual spreadsheet environments. These include formula errors, stale data inputs, version control issues, and the absence of automated reconciliation. In a regulatory review, these failures often result in full revalidation of the actuarial assumptions and, in some cases, restatements.
How do you select the right mortality table for IAS 19?
Selecting a mortality table requires matching the table to the population’s characteristics, including age profile, gender split, and geographic location. You should also apply a mortality improvement scale to reflect projected longevity trends. The actuary should document the selection basis and confirm it reflects the plan’s specific membership profile, not just a generic national average.
Where demographic errors lead and how to stop them
Demographic projection errors don’t always announce themselves. They accumulate quietly across reporting cycles, compounding in the DBO until an experience study or auditor review brings them to the surface. By then, the restatement risk is real.
The fix isn’t complicated in principle. It starts with clean data, current assumptions, and a documented review process. It requires actuaries and finance teams to work together, not independently. And it requires a system that doesn’t let outdated inputs pass through unchecked.
IAS 19 valuation done well protects your financial statements and your organization’s credibility with auditors, regulators, and investors. If you need help reviewing your current assumption framework or identifying gaps in your demographic data, the advisory team at Prima Consulting works with organizations across the region on exactly this.